Oracle have provided many performance gathering and reporting tools over the years. Originally the UTLBSTAT/UTLESTAT scripts were used to monitor performance metrics. Oracle8i introduced the Statspack functionality which Oracle9i extended. In Oracle 10g statspack has evolved into the Automatic Workload Repository (AWR).
- AWR Features
- Snapshots
- Baselines
- Workload Repository Views
- Workload Repository Reports
- Enterprise Manager
- Reading AWR Reports (Beginners Approach)
- SQL Developer and AWR Reports
AWR Features
The AWR is used to collect performance statistics including:
- Wait events used to identify performance problems.
- Time model statistics indicating the amount of DB time associated with a process from the
V$SESS_TIME_MODELandV$SYS_TIME_MODELviews. - Active Session History (ASH) statistics from the
V$ACTIVE_SESSION_HISTORYview. - Some system and session statistics from the
V$SYSSTATandV$SESSTATviews. - Object usage statistics.
- Resource intensive SQL statements.
The repository is a source of information for several other Oracle 10g features including:
Snapshots
By default snapshots of the relevant data are taken every hour and retained for 7 days. The default values for these settings can be altered using the following procedure.
BEGIN
  DBMS_WORKLOAD_REPOSITORY.modify_snapshot_settings(
    retention => 43200,        -- Minutes (= 30 Days). Current value retained if NULL.
    interval  => 30);          -- Minutes. Current value retained if NULL.
END;
/
The changes to the settings are reflected in the
DBA_HIST_WR_CONTROL view. Typically the retention period should capture at least one complete workload cycle. If you system has monthly archive and loads a 1 month retention time would be more beneficial that the default 7 days. An interval of "0" switches off snapshot collection, which in turn stops much of the self-tuning functionality, hence this is not recommended. Automatic collection is only possible if the STATISTICS_LEVEL parameter is set to TYPICAL or ALL. If the value is set to BASIC manual snapshots can be taken, but they will be missing some statistics.
Extra snapshots can be taken and existing snapshots can be removed, as shown below.
EXEC DBMS_WORKLOAD_REPOSITORY.create_snapshot;

BEGIN
  DBMS_WORKLOAD_REPOSITORY.drop_snapshot_range (
    low_snap_id  => 22,
    high_snap_id => 32);
END;
/
Snapshot information can be queried from the
DBA_HIST_SNAPSHOT view.Baselines
A baseline is a pair of snapshots that represents a specific period of usage. Once baselines are defined they can be used to compare current performance against similar periods in the past. You may wish to create baseline to represent a period of batch processing.
BEGIN
  DBMS_WORKLOAD_REPOSITORY.create_baseline (
    start_snap_id => 210,
    end_snap_id   => 220,
    baseline_name => 'batch baseline');
END;
/
The pair of snapshots associated with a baseline are retained until the baseline is explicitly deleted.
BEGIN
  DBMS_WORKLOAD_REPOSITORY.drop_baseline (
    baseline_name => 'batch baseline',
    cascade       => FALSE); -- Deletes associated snapshots if TRUE.
END;
/
Baseline information can be queried from the
DBA_HIST_BASELINE view.Workload Repository Views
The following workload repository views are available:
V$ACTIVE_SESSION_HISTORY- Displays the active session history (ASH) sampled every second.V$METRIC- Displays metric information.V$METRICNAME- Displays the metrics associated with each metric group.V$METRIC_HISTORY- Displays historical metrics.V$METRICGROUP- Displays all metrics groups.DBA_HIST_ACTIVE_SESS_HISTORY- Displays the history contents of the active session history.DBA_HIST_BASELINE- Displays baseline information.DBA_HIST_DATABASE_INSTANCE- Displays database environment information.DBA_HIST_SNAPSHOT- Displays snapshot information.DBA_HIST_SQL_PLAN- Displays SQL execution plans.DBA_HIST_WR_CONTROL- Displays AWR settings.
Workload Repository Reports
Oracle provide two scripts to produce workload repository reports (awrrpt.sql and awrrpti.sql). They are similar in format to the statspack reports and give the option of HTML or plain text formats. The two reports give essential the same output but the awrrpti.sql allows you to select a single instance. The reports can be generated as follows.
@$ORACLE_HOME/rdbms/admin/awrrpt.sql
@$ORACLE_HOME/rdbms/admin/awrrpti.sql
The scripts prompt you to enter the report format (html or text), the start snapshot id, the end snapshot id and the report filename. The resulting report can be opend in a browser or text editor accordingly.
An example of a HTML AWR report can be seen here.
Enterprise Manager
The automated workload repository administration tasks have been included in Enterprise Manager. The "Automatic Workload Repository" page is accessed from the main page by clicking on the "Administration" link, then the "Workload Repository" link under the "Workload" section. The page allows you to modify AWR settings or manage snapshots without using the PL/SQL APIs.
Reading AWR Reports (Beginners Approach)
If you are new to the AWR reports, the first thing you should probably do is run the ADDM report for the specific time period. The ADDM report provides root cause analysis of the parts of the system consuming the most time. It is often quicker to start with the ADDM report to help narrow down your area of focus in the AWR report.
When looking at an AWR report, a good place to start is the "Top 5 Timed Foreground Events" section, near the top of the report. This gives you an indication of the bottlenecks in the system during this sample period.
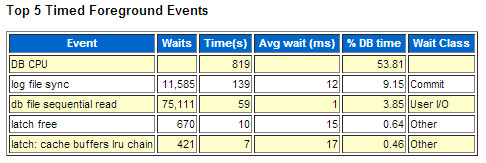
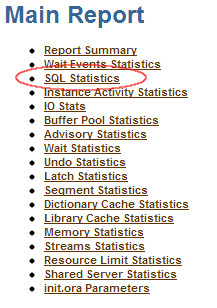
Once you've identified the top events, drill down to see what SQL and PL/SQL are consuming the majority of those resources. On the "Main Report" section, click the "SQL Statistics" link.
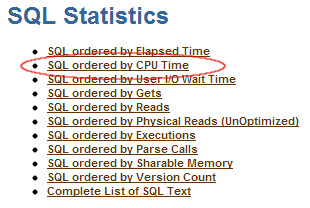
On the "SQL Statistics" section, click the "SQL ordered by ??" link that most closely relates to the wait event you identified in the "Top 5 Timed Foreground Events" section. In this case, the "DB CPU" was the top event, so it would seem sensible to try the "SQL ordered by CPU Time" link first.
You are then presented with the SQL and PL/SQL that are using most of the specified resource during the sample period. You can then attempt to tune these areas to reduce the impact.
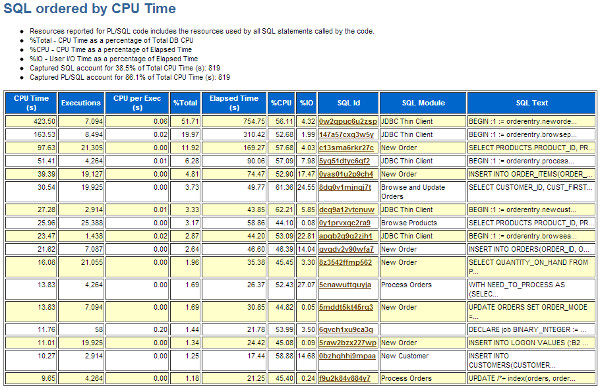
Repeat this process for the other top events.
SQL Developer and AWR Reports
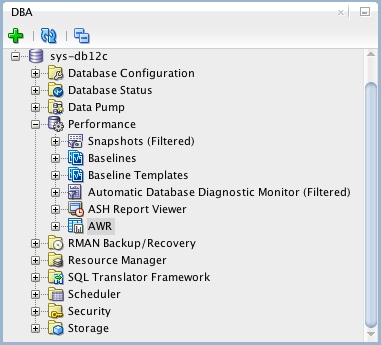
If you are using SQL Developer 4 onward, you can view AWR reports directly from SQL Developer. If it is not already showing, open the DBA pane "View > DBA", expand the connection of interest, then expand the "Performance" node. The AWR reports are available from the "AWR" node.

No comments:
Post a Comment